Suggestions © OpenStreetMap contributors · Photon
You are here
SunSense
—
4.1years
Payback
System size2.3 kW≈ 5 panels
Yearly generation3,022kWh per year
Cost before subsidy₹1,26,500installed
Subsidy₹65,400PM Surya Ghar
Monthly bill₹1,245 → ₹0energy + fixed charge
CO₂ avoided2.5 tper year
Grid vs solar over 25 years
Month by month
PVGIS 5.3 · EU JRCkWh
Solar potential across India
PVGIS 5.3 · 2005–2023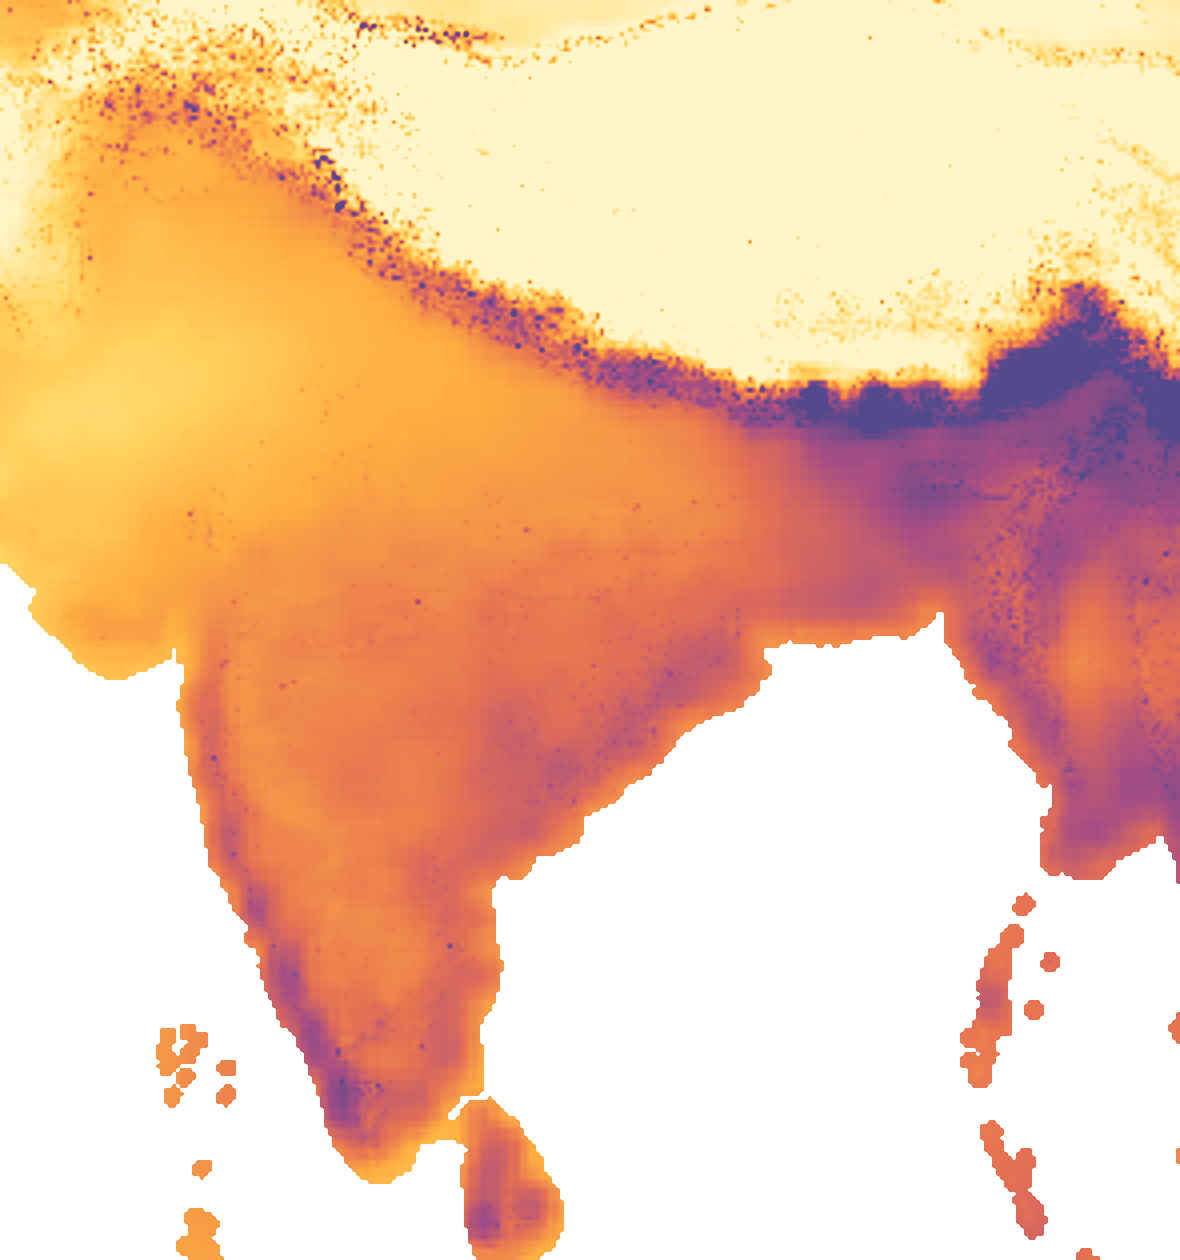
kWh produced per kW of panels a year, at the best fixed angle.
PVGIS © European Union, 2001–2026 · CC BY 4.0
On your roof
How this is calculated
- Size = monthly units ÷ (30 × sun hours × 0.8), capped at roof area ÷ 10 m² per kW.
- Generation = kW × sun hours × 365 × 0.8 (inverter, wiring, heat and dust losses).
- Cost ₹55,000 per kW installed. PM Surya Ghar subsidy: ₹30,000/kW for the first 2 kW and ₹18,000 for the 3rd (max ₹78,000); 10% more in North-East and hill states, J&K, Ladakh and the islands (max ₹85,800). On-grid only.
- Your bill uses your state board's latest domestic tariff (energy slabs + fixed charge), read from the regulator's tariff order. Electricity duty, fuel surcharges and state free-unit schemes are not included. Sanctioned load is assumed at about 1 kW per 100 units a month.
- Net metering: solar units first cancel your own use, so the bill falls from the top slab down. Fixed charges stay.
- Grid vs solar: bills rise by the % you choose each year; panels lose 0.5% output a year; upkeep is 1% of the system cost a year.
- CO₂ = generation × 0.82 kg per kWh (CEA grid baseline).
- Off-grid battery cost isn't included yet.
Solar lab
PVGIS 5.3 · EU JRC